In recent years, the population of Tucson/Pima County increased while the creation of new housing has slowed since the 2007-2009 housing market crash. Increasing demand for housing, in the context of limited supply, is pushing up both housing prices and rental costs. As the cost of rent has risen faster than the incomes of local residents there are increasingly not enough rental units that are affordable for many of our community members.
As a result, housing insecurity is impacting the most vulnerable residents in our community and both evictions and the number of people experiencing homelessness in Pima County have risen in recent years. The lack of affordable housing reduces the ability of displaced folks to relocate and undermines the ability of homeless service providers to rehouse individuals and families experiencing homelessness. Pima County has a comparatively high poverty rate, a large share of low wage occupations, and a significant number of residents who lived on fixed incomes. As rents continue to rise larger numbers of vulnerable households will be at risk of housing insecurity and homelessness.
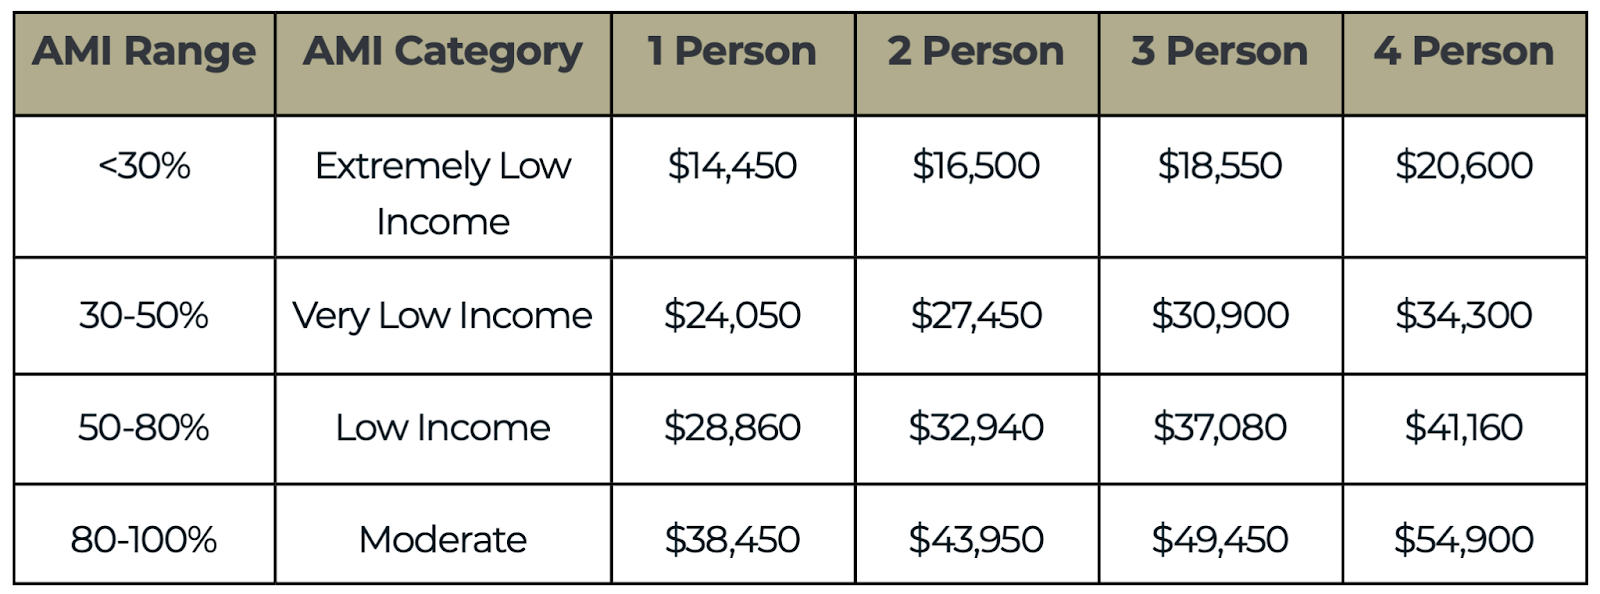
Source: City of Tucson, Housing and Community Development Department. Housing Affordability Plan For Tucson (HAST)
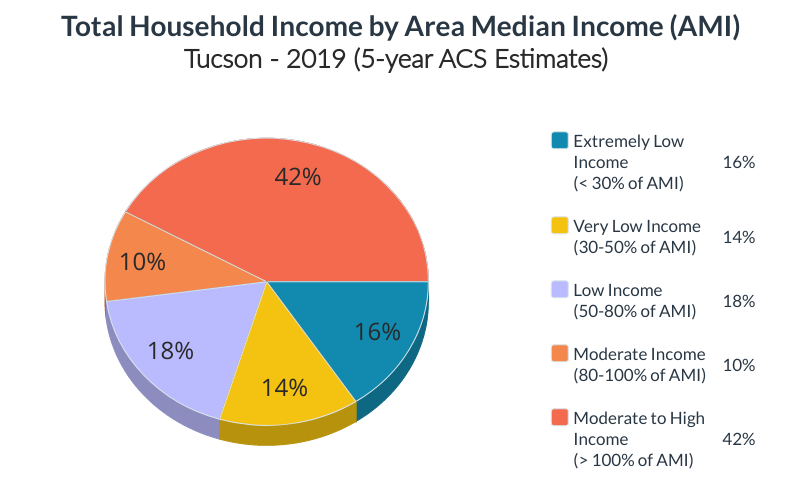
Source: City of Tucson, Housing and Community Development Department. Housing Affordability Plan For Tucson (HAST)
The table above provides the AMI thresholds determining whether households fell into various income categories in Pima County in 2019. Based on these thresholds, the distribution of household incomes in Tucson in 2019 is displayed in the pie chart below.
Source: City of Tucson, Housing and Community Development Department. Housing Affordability Plan For Tucson (HAST)
This distribution is based on the household incomes of all occupied housing units in Tucson in 2019, estimated to be 212,491 units. Depending on your familiarity with such data, it may or may not surprise you to see how many low income households we have in our community. Using these thresholds, in 2019, the total household income of 48% of Tucson’s households fell within or below the “low income” category (meaning they made less than roughly $29k for person living alone, $33k for a 2 person household, $37k for a three person household, and so on).
Now that these categories have some real life dollar figures attached to them, we can examine some of the characteristics of the households in these different income brackets. The figure below displays the actual number of households who are renters or owners in Tucson by their income category. So of the roughly 33,200 Tucson households categorized as extremely low income in 2019, 76% were renters and 24% owned their homes. As one might expect, lower income households are much more likely to rent and are consequently much more impacted by changes in rental costs and shifts in the availability of lower-end (and more affordable) rental units.
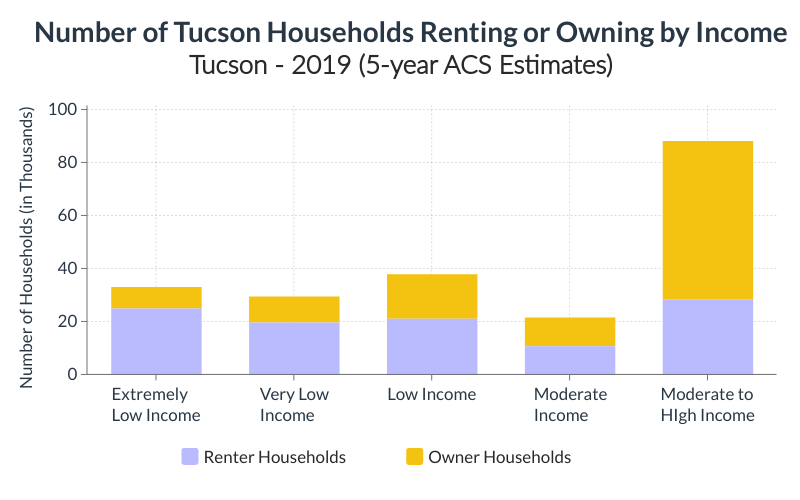
Source: City of Tucson, Housing and Community Development Department. Housing Affordability Plan For Tucson (HAST)
Now (after all that build-up!) we can examine the proportions of households in these various income categories who were housing burdened in Tucson in 2019. Again this means that a household’s housing costs (their rent or mortgage payments plus other housing expenses) exceeds 30% of the household’s total income. As is clear from the figure below, the vast majority, 77%, of very low income households in Tucson are in this situation. A 2021 analysis by the City of Tucson (using these 2019 data) estimated that there are roughly 75,000 households in Tucson that are housing cost burdened using this definition.
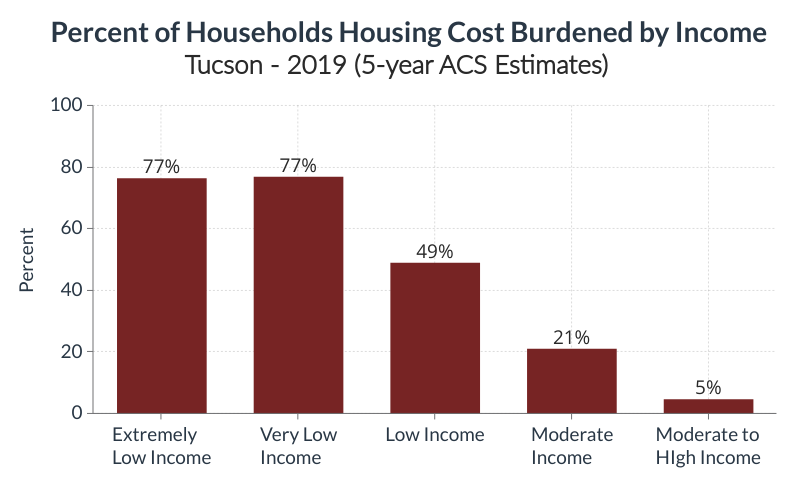
Source: City of Tucson, Housing and Community Development Department. Housing Affordability Plan For Tucson (HAST)
Source: City of Tucson, Housing and Community Development Department. Housing Affordability Plan For Tucson (HAST)
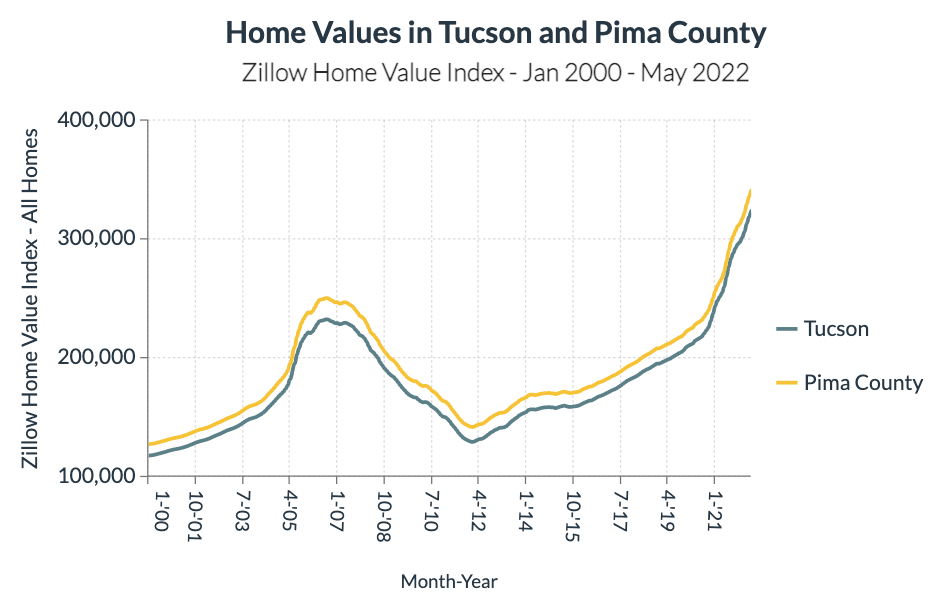
The story here is primarily one of demand for housing outstripping supply, and prices increasing as a consequence. And while more difficult to quantify, housing experts also agree that the popularity of short-term rentals (e.g. AirBnB) have removed a meaningful number of housing units from the residential market. In addition, some investors have been engaging in the practice of “flipping” both homes and apartment complexes. When this activity involves buying lower-end properties and rehabbing them for the market at higher prices, both the size of the stock of affordable housing is reduced and average rents are raised. In combination, these developments have produced dramatic increases in home prices and rents in recent years.
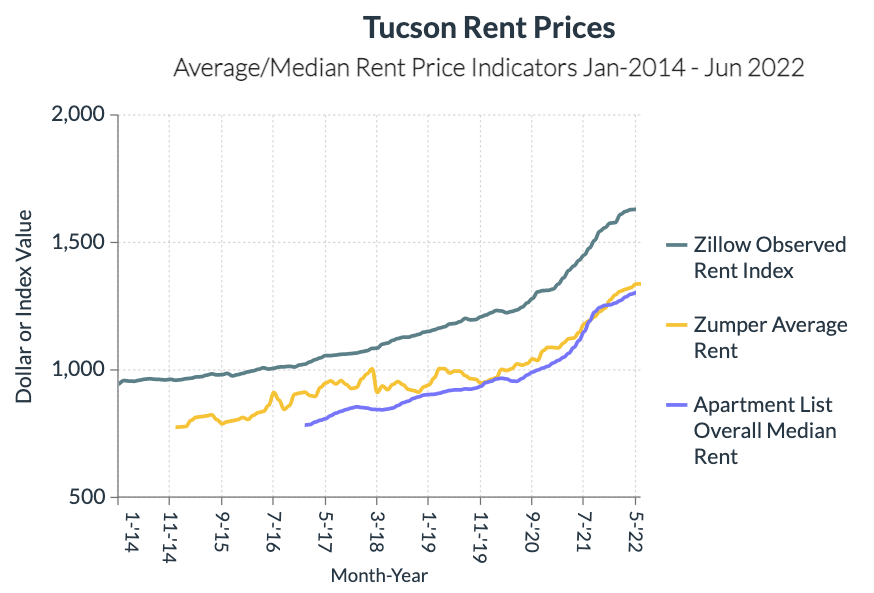
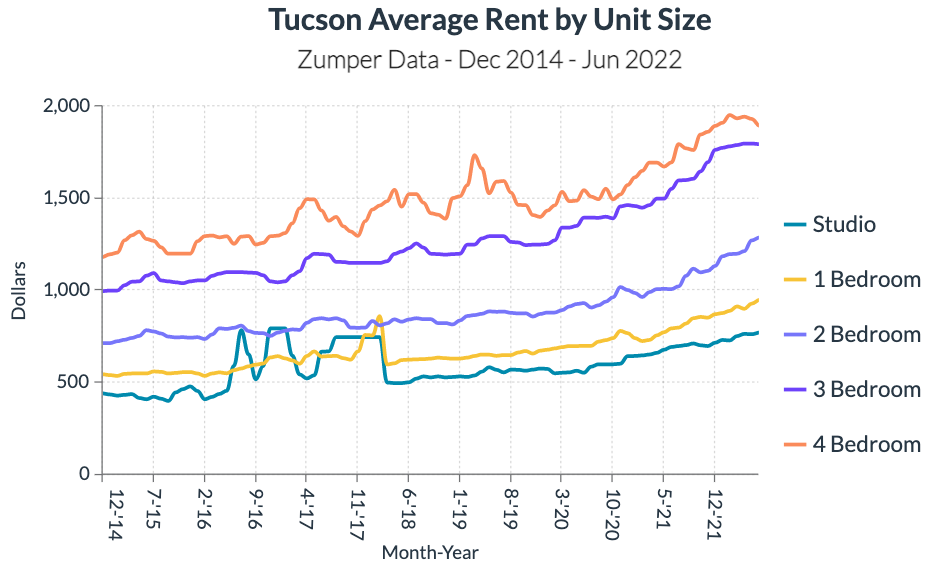
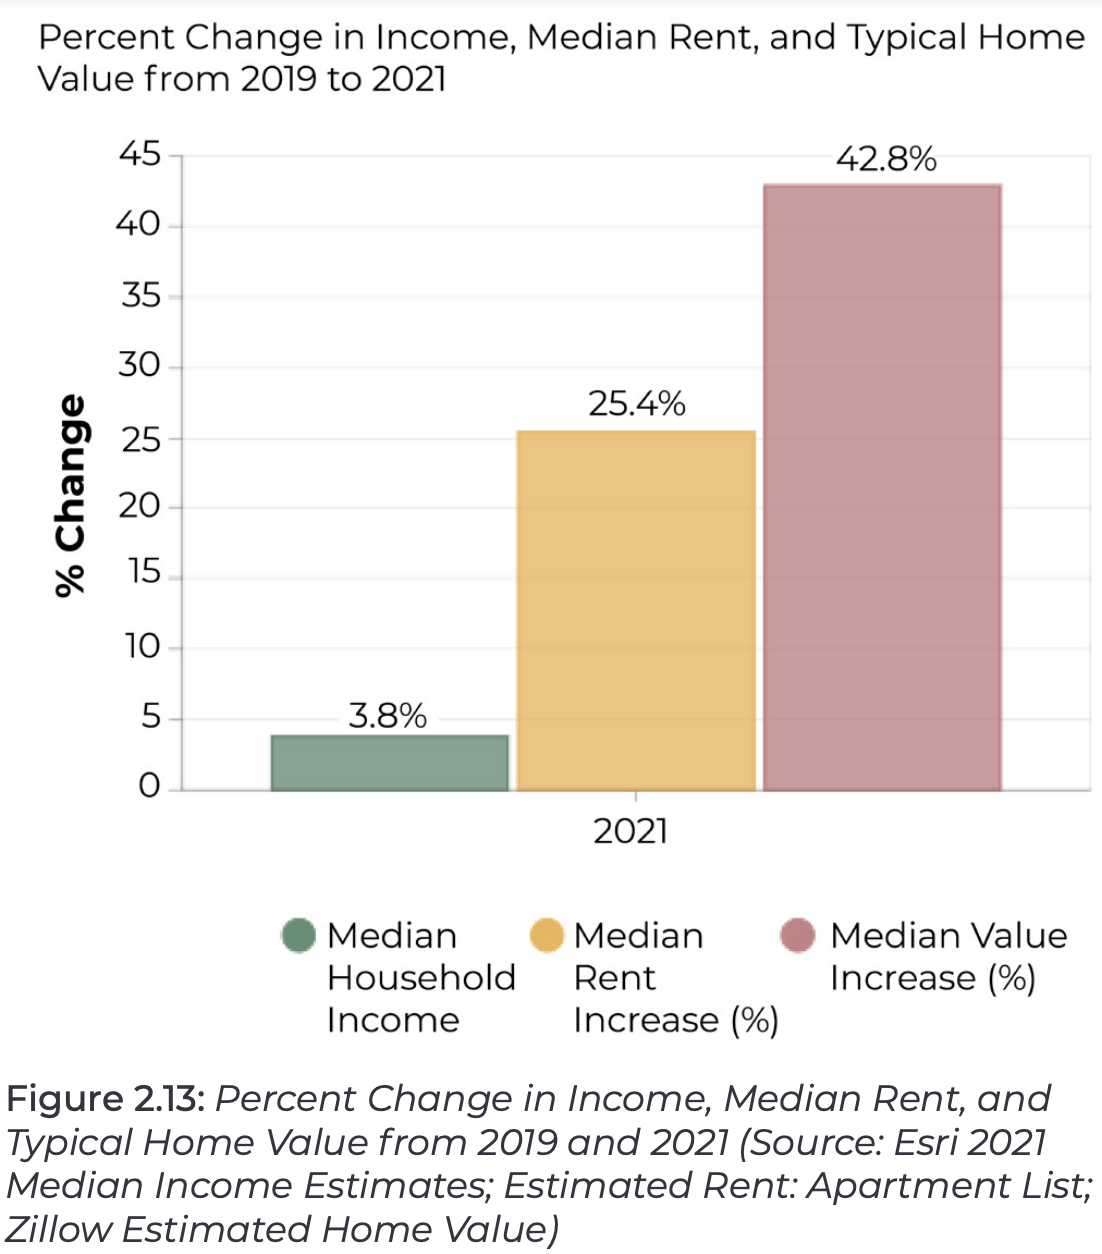
Between May 2020 and May 2022, these measures of average or median rent prices indicate that rents in Tucson have increased 33-36% in recent years. These summary measures are useful, but people don’t rent an average or median unit, they rent a studio or a 2 bedroom apartment. The graph below displays average rents in Tucson by unit size (studio, 1 bedroom, etc.) in current dollars not adjusted for inflation. Adjusting for inflation (adjusting rents to 2022 dollars) the cost of rent in Tucson between June 2020 and June 2022 rose: 23% for studios, 20% for 1 bedroom units, 22% for 2 bedroom units, 14% for 3 bedroom units, and 9% for 4 bedroom units. While difficult to see in the graph, the cost of smaller and more affordable rental units has risen faster than larger (3 or 4 bedroom) units.
And as you might have guessed, household incomes have not kept pace with these dramatic increases in prices in recent years.
Source: City of Tucson, Housing and Community Development Department. Housing Affordability Plan For Tucson (HAST)
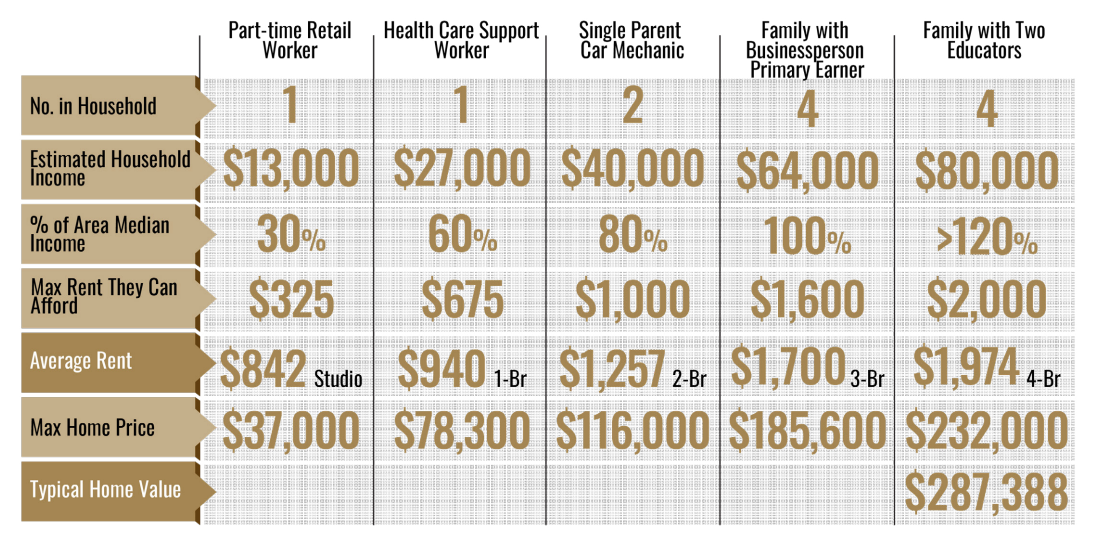
In order to illustrate how out of reach these rent and home prices are for some of our community members, in their 2021 report the City of Tucson provided examples of incomes relative to costs for different hypothetical individuals with different family sizes and common occupations in Tucson.
Source: City of Tucson, Housing and Community Development Department. Housing Affordability Plan For Tucson (HAST)
We call these developments an affordable housing crisis because Tucson and Pima County are places with large numbers of financially vulnerable residents. Compared to cities of similar size, Tucson has a high poverty rate and a large share of low wage workers. This means that even modest increases in rents can result in housing insecurity or displacement for a substantial portion of our community members. And further, by definition, these lower income folks are the least able to mitigate these financial challenges.
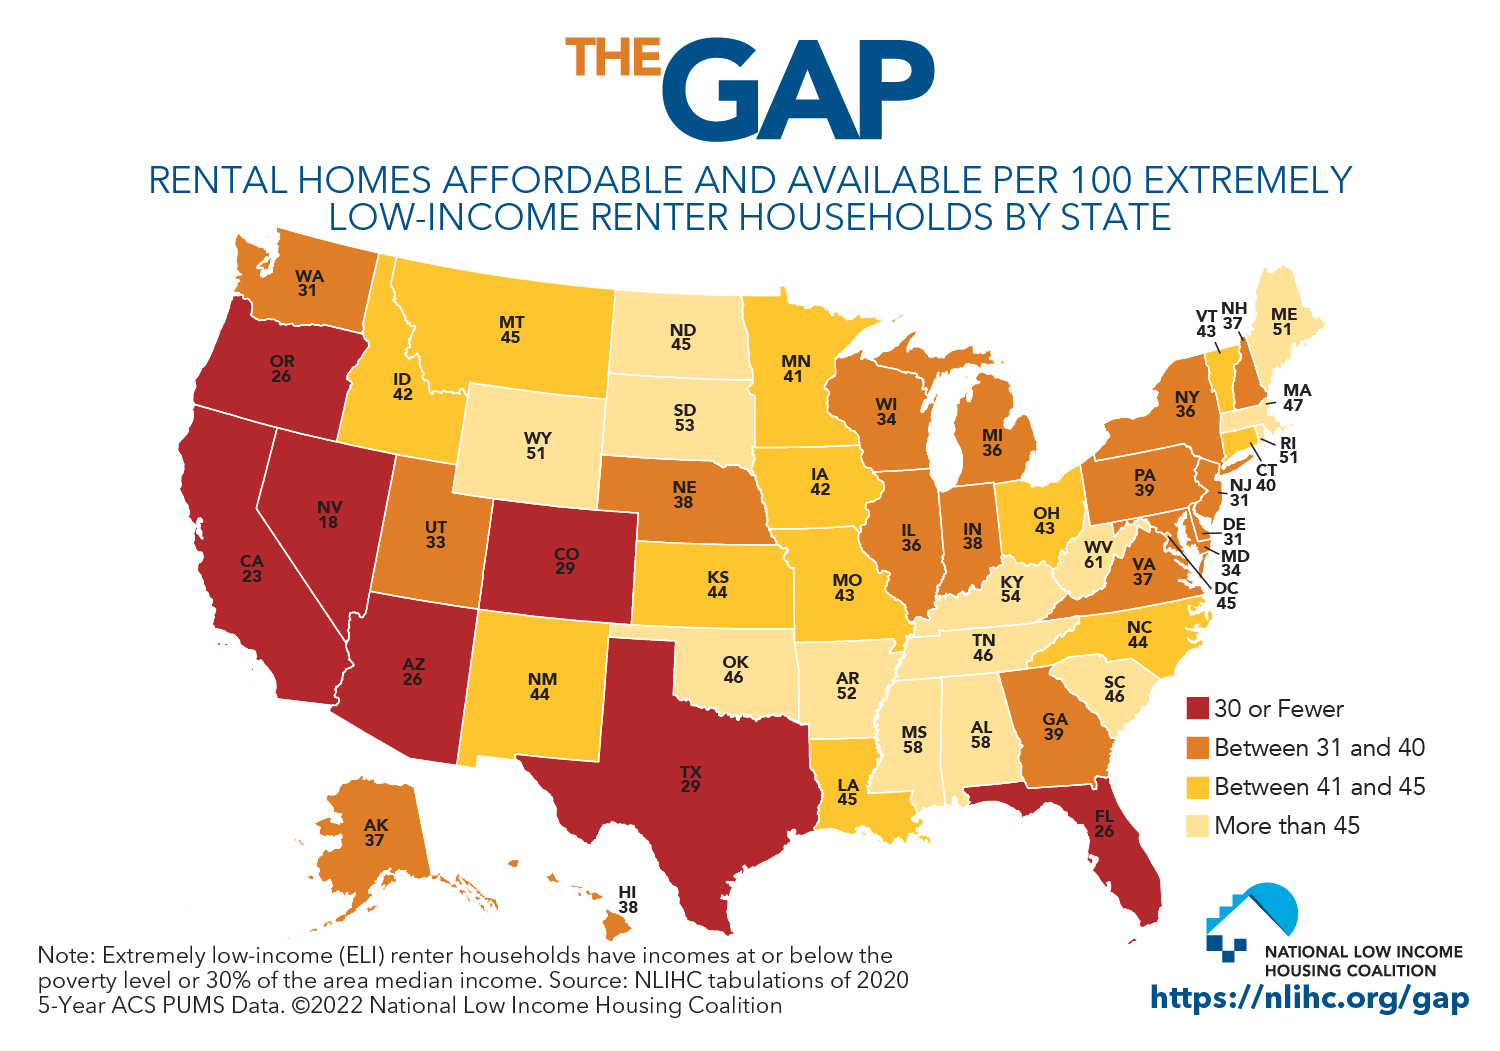
As mentioned above, the City of Tucson estimated that 77% of low income households in Tucson were housing cost burdened in 2019. The National Low Income Housing Coalition released a recent report which found that for every 100 extremely low income households in Arizona there are only 26 rental units that are both available and affordable. This NLIHC report which indicates a severe shortage of affordable housing in Arizona is based on 2020 ACS data. Low income households in Arizona were already in a challenging situation before the dramatic increases in home prices and rents that have occurred since 2020.
Since 2020, we have experienced the pandemic and an accompanying deep recession. We mention this to acknowledge that recent years have provided a wide range of additional challenges that may have contributed to increased housing insecurity including: the loss of a household member’s earnings as a result of a COVID-related death or disability, job losses due to the recession, or changes in caretaking responsibilities that prevent labor market participation (especially for women). All of these challenges have emerged in recent years as home and rent prices have risen, and have contributed to the trends of rising evictions and homelessness.
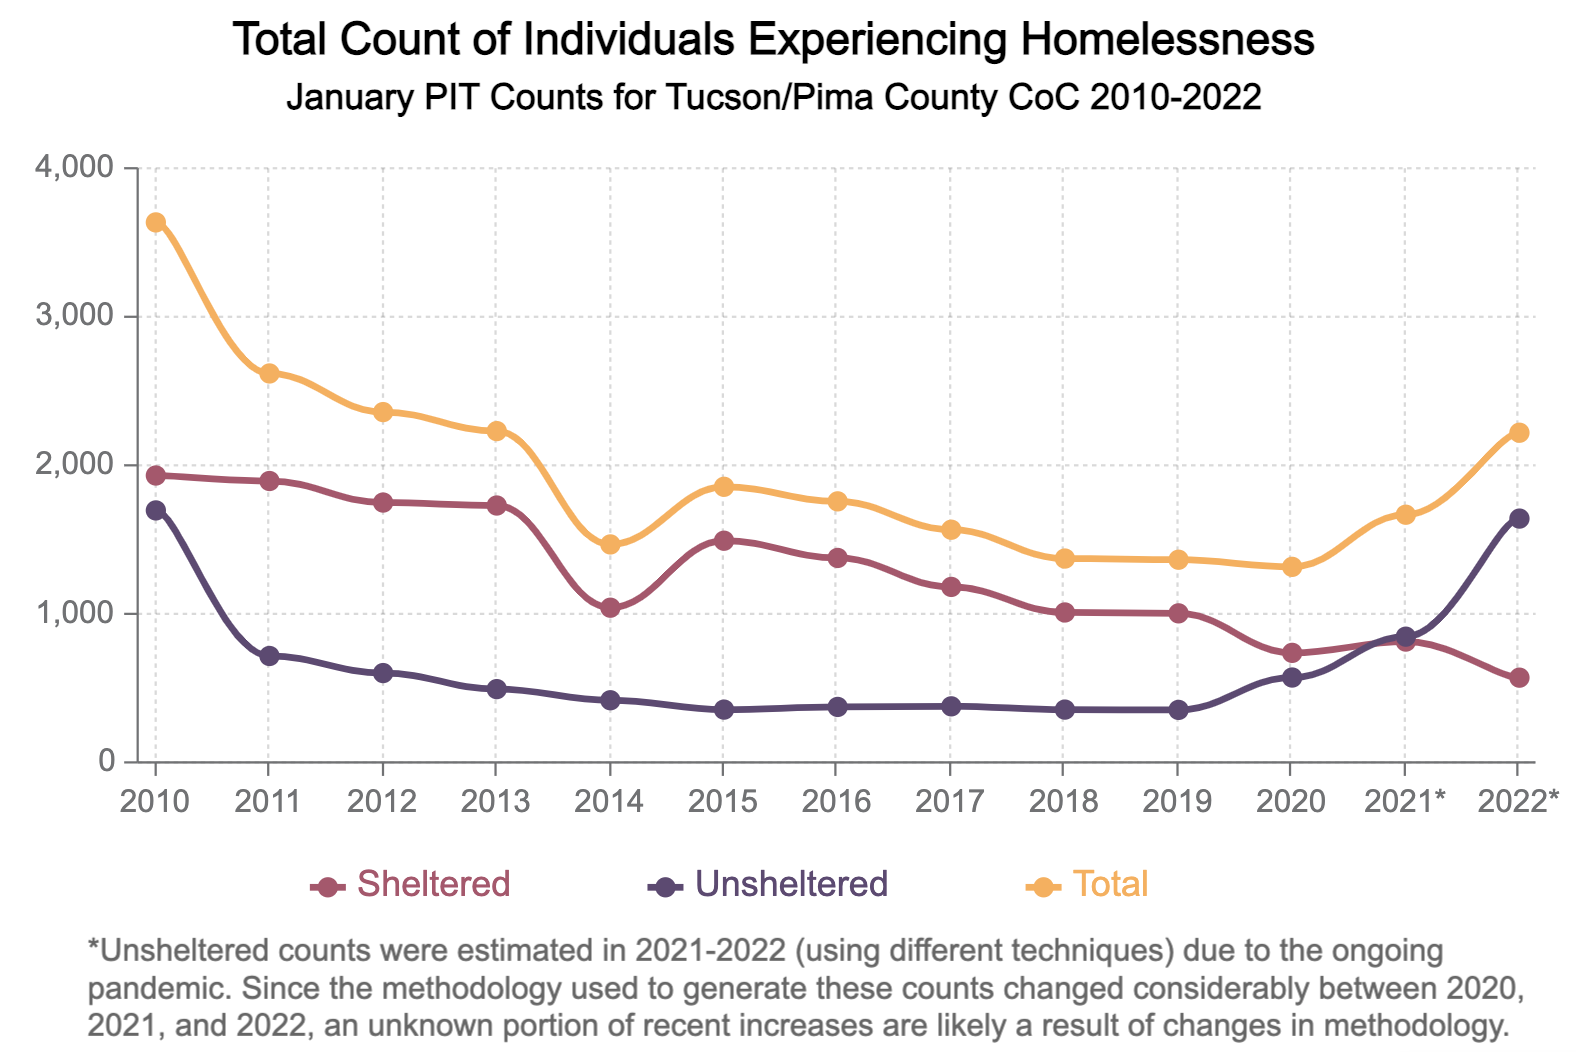
Source: Bentele, K. (2022). Housing Insecurity Indicators and Homelessness Estimates for Arizona and Pima County – 33rd Report. Tucson, AZ: University of Arizona, Southwest Institute for Research on Women.
A quick qualifier on the numbers of people experiencing homelessness in Pima County is warranted. The graph above, which presents the official counts reported to HUD, suggests a dramatic increase in the number of people experiencing unsheltered homelessness between 2020 and 2022. Because of the pandemic, the normal method used to count the number of people experiencing unsheltered homelessness in Pima County was canceled in both 2021 and 2022. The alternative method used in 2022 very likely contributed to a higher than normal count (relative to what would have been found using traditional methods), but it is important to emphasize that the alternative count for 2022 is based on a count of real people experiencing homelessness. While we cannot know the precise magnitude of the increase, the best available data, as well as feedback from local service providers and law enforcement, all indicate that the number of people experiencing homelessness in Tucson has increased substantially relative to 2020.
An eviction or a spell of homelessness can be intense, and in some cases, highly traumatic experiences. Unfortunately, people who belong to marginalized groups (e.g. low income, people of color, people with disabilities, seniors) are disproportionately at risk of housing insecurity and homelessness. In recent months, Pima County constables have reported seeing increasing numbers of elderly individuals and people with disabilities experiencing evictions. People living on fixed incomes are especially vulnerable to displacement as rent increases outstrip their benefits or retirement income. The lack of availability of affordable housing can make it difficult or impossible for such individuals to find an affordable place to relocate locally.
In addition, the lack of affordable housing options is currently undermining the efficacy of our programs and services intended to reduce homelessness. The already extremely long wait times for housing placements are getting longer, and service providers working with people experiencing homelessness report that a central barrier to the enactment of gold standard Housing First practices is the lack of local affordable housing. As rents continue to rise the lack of affordable housing options increases the risk of a displacement translating into a spell of homelessness in an environment where the demand for services for people experiencing homelessness is already high (which increases the likelihood that a spell of homelessness will take longer to resolve via public or nonprofit services).
The members of our community who are the most likely to experience the stress and strains of this housing insecurity are disproportionately the folks who are the most marginalized, the most likely to have already experienced significant trauma, and, again, are the folks with the least resources available to negotiate these challenges. We at the Tucson Alliance for Housing Justice refuse to accept this as a “natural” outcome of the economics of the housing market. We believe the harm being inflicted on our most vulnerable community members is preventable and reversible.
Send us a message or join our mailing list by entering your information here. We will get back to you as soon as possible. If you have received an eviction notice and need immediate assistance, please contact Pima County EELS at 520-724-3357.
Envíenos un mensaje o únase a nuestra lista de correo ingresando su información aquí. Nos comunicaremos con usted lo antes posible. Si recibió un aviso de desalojo y necesita asistencia inmediata, comuníquese con Pima County EELS al 520-724-3357.
Website creation supported with funding from the City of Tucson Housing and Community Development Department and Tucson Pima Collaboration to End Homelessness.